Optimizing Particulate Separation: Stairmand Cyclone Separator CFD and Hoekstra Validation
Overview
Evaluating the performance of gas-solid separation equipment requires highly accurate modeling of strongly swirling flows. In this project, we conducted an advanced multiphase CFD simulation of a Stairmand cyclone particle separator to evaluate velocity fields and fractional collection efficiencies. By validating our numerical models against the widely recognized experimental data by Hoekstra, we provide verified, industry-ready simulation workflows that reduce design risk and optimize industrial separation performance.
Turbulence Modeling Philosophy & Multiphase Framework
Overcoming Anisotropic Turbulence
Standard eddy-viscosity formulations, such as the Shear Stress Transport (k−ω SST) model, proved insufficient for this application, yielding an error of approximately 20% in velocity field predictions. This limitation stems from the model’s assumption of isotropic turbulence, which fails to capture the severe directional variations in Reynolds stresses inherent to strongly swirling flows.
To resolve this, a Reynolds Stress Model was deployed. By explicitly solving the individual transport equations for the Reynolds stresses, the RSM accurately captured the anisotropic core of the cyclone, reducing the total pressure drop prediction error to less than 10% against the experimental data.
Particulate Tracking & Physical Boundaries
For the discrete phase, a Discrete Phase Model (DPM) was implemented under a Lagrangian tracking framework. Because the solid phase maintained a dilute concentration (volume fraction less than 10%), a one-way or two-way coupled DPM approach provided excellent computational efficiency.
However, validation highlighted critical physical boundaries based on particle size:
Diameters greater than 1 μm: The DPM accurately predicted particle trajectories and fractional collection efficiencies, aligning closely with physical expectations.
Sub-micron Particles (less than 1 μm): At this scale, standard aerodynamic drag laws lose dominance. To capture sub-micron behavior accurately, advanced coding extensions are required to account for electrostatic forces (field charges) and inter-particle agglomeration.
Validation Performance & Performance Metrics
The CFD results demonstrate high fidelity when compared against the Hoekstra experimental benchmarks. By utilizing the Reynolds Stress Model to resolve the complex vortex core, the simulation achieves a rigorous degree of accuracy across both primary performance indicators:
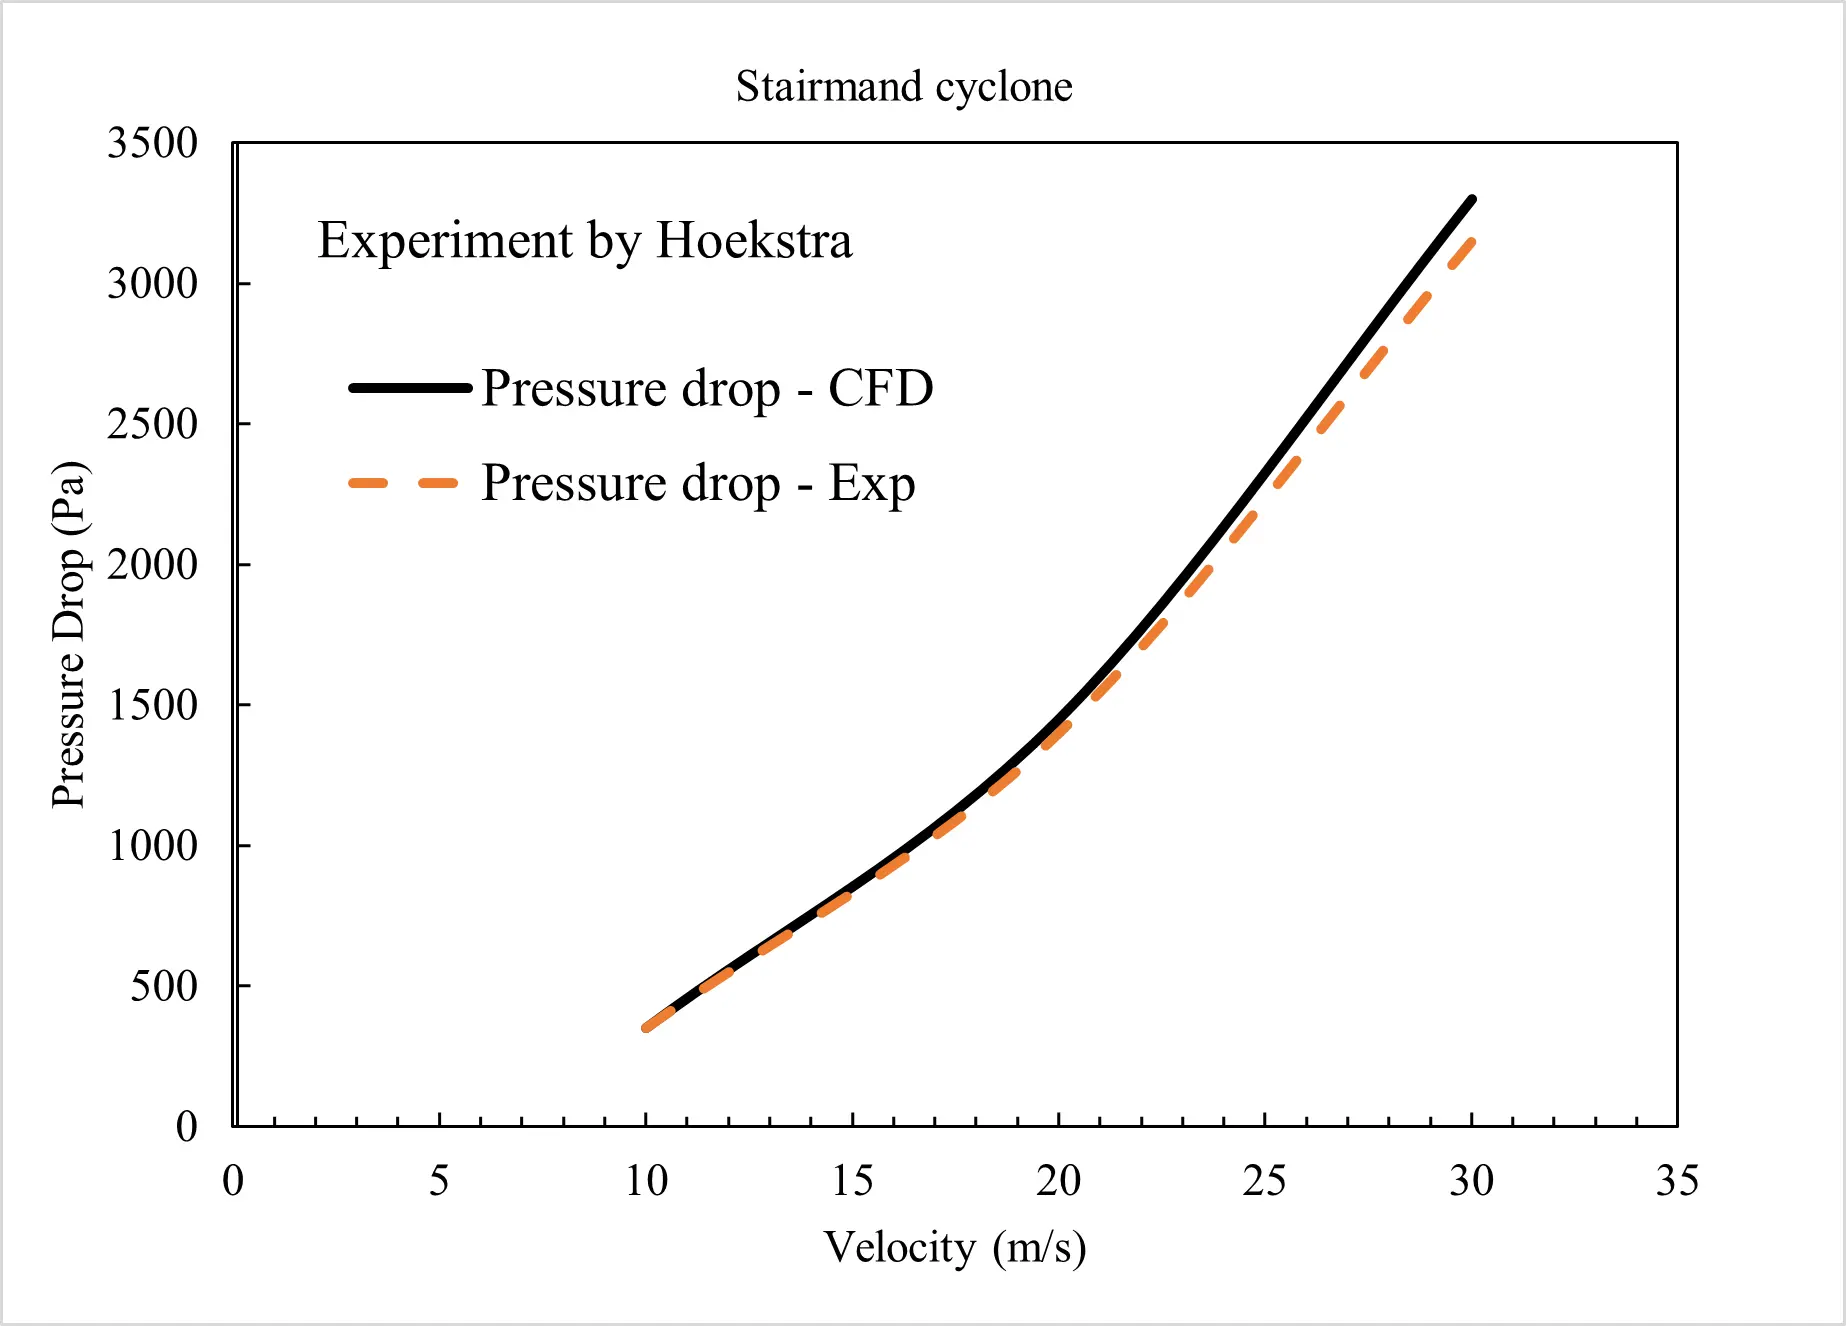
Pressure Drop: The predicted pressure differential across the cyclone aligns with experimental results within a 10% error margin, providing a reliable basis for fan sizing and energy consumption calculations.
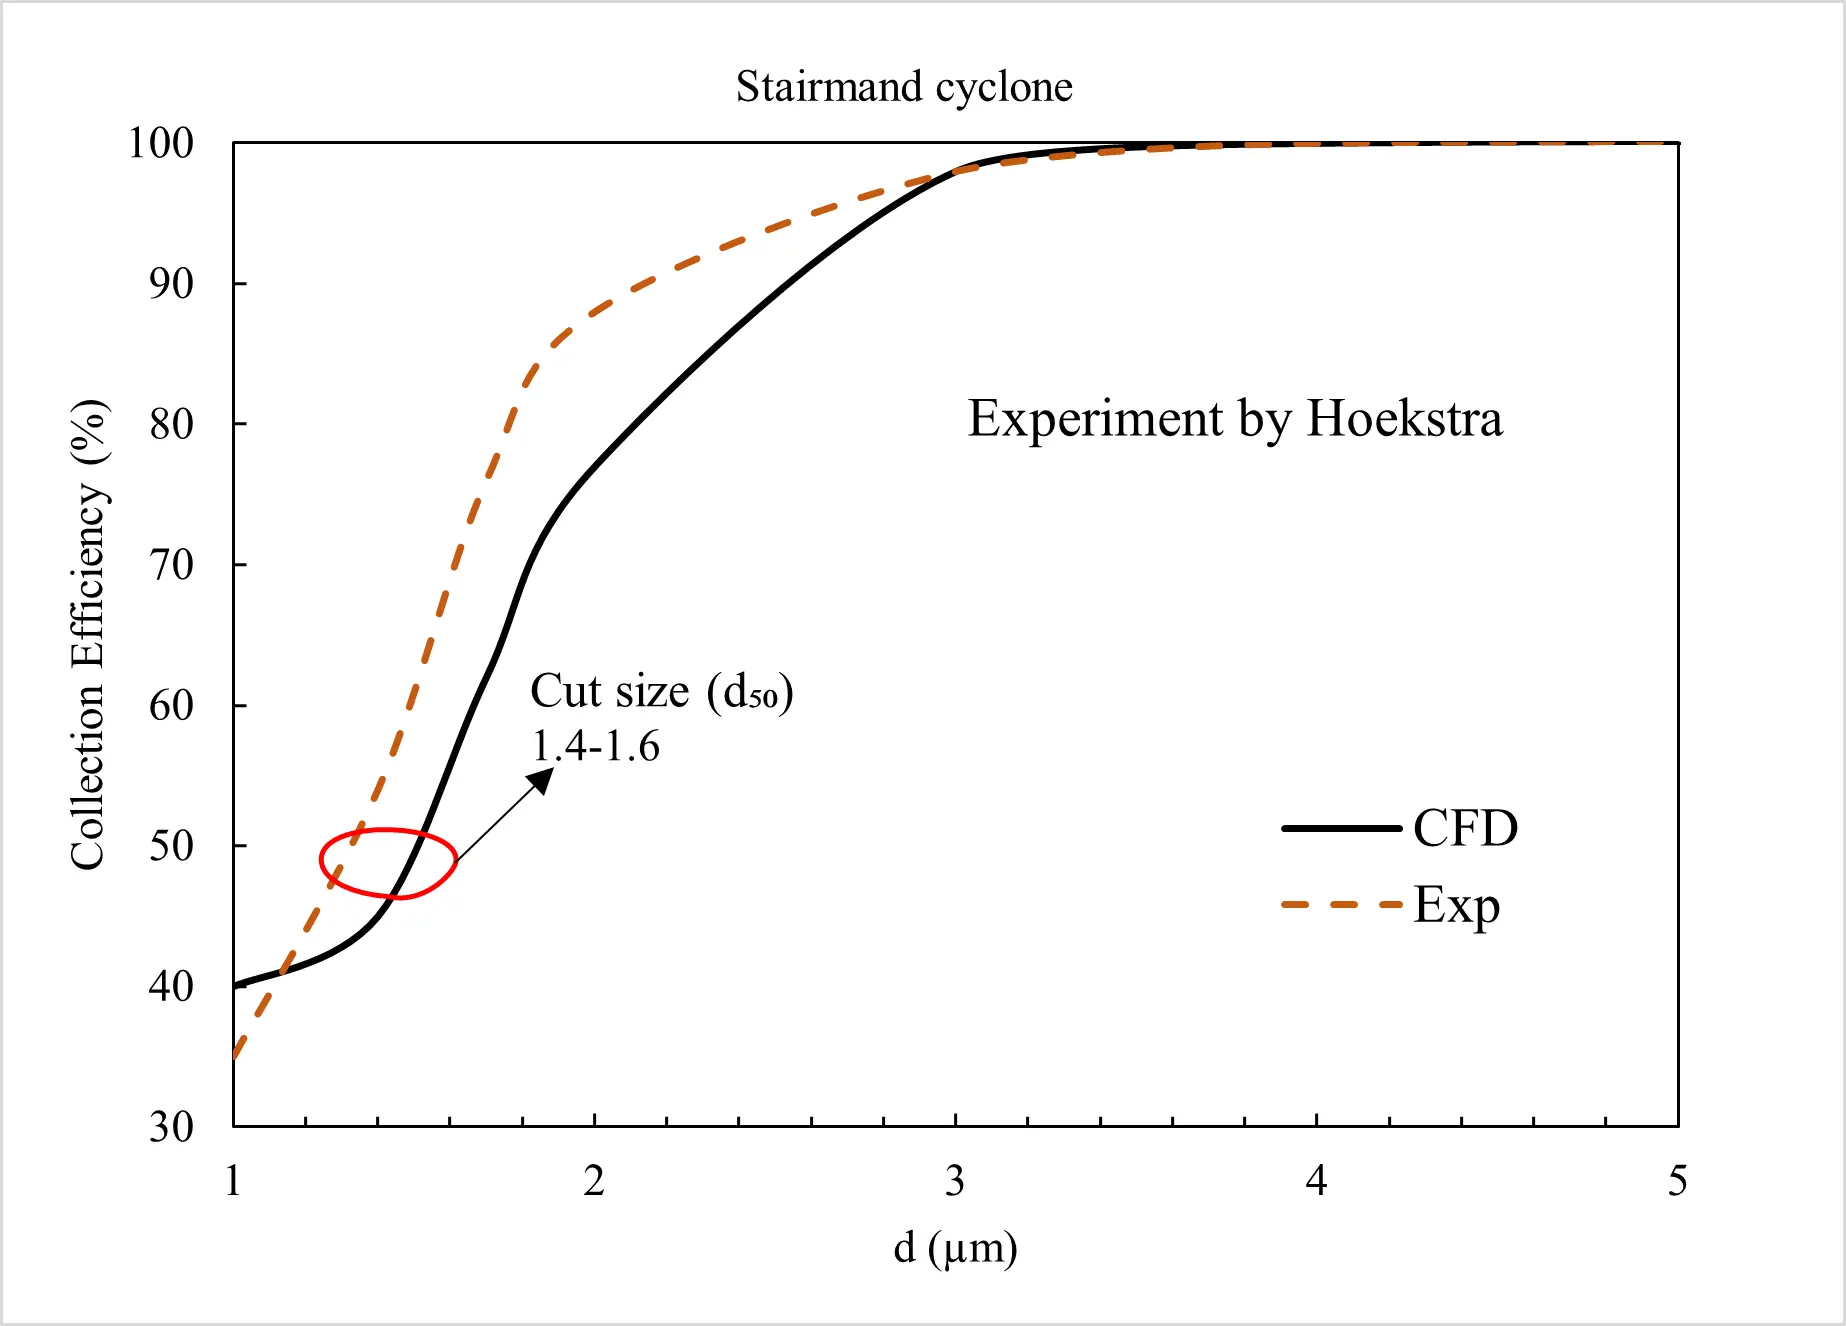
Collection Efficiency: The fractional efficiency curves show excellent agreement with the validation data, accurately capturing the “cut size” (d50) and the separation performance across the particle size distribution.
These results confirm that the numerical framework is robust and can be confidently applied to industrial cyclone optimization and design-stage performance prediction.
Flow Visualization and Particulate Distribution
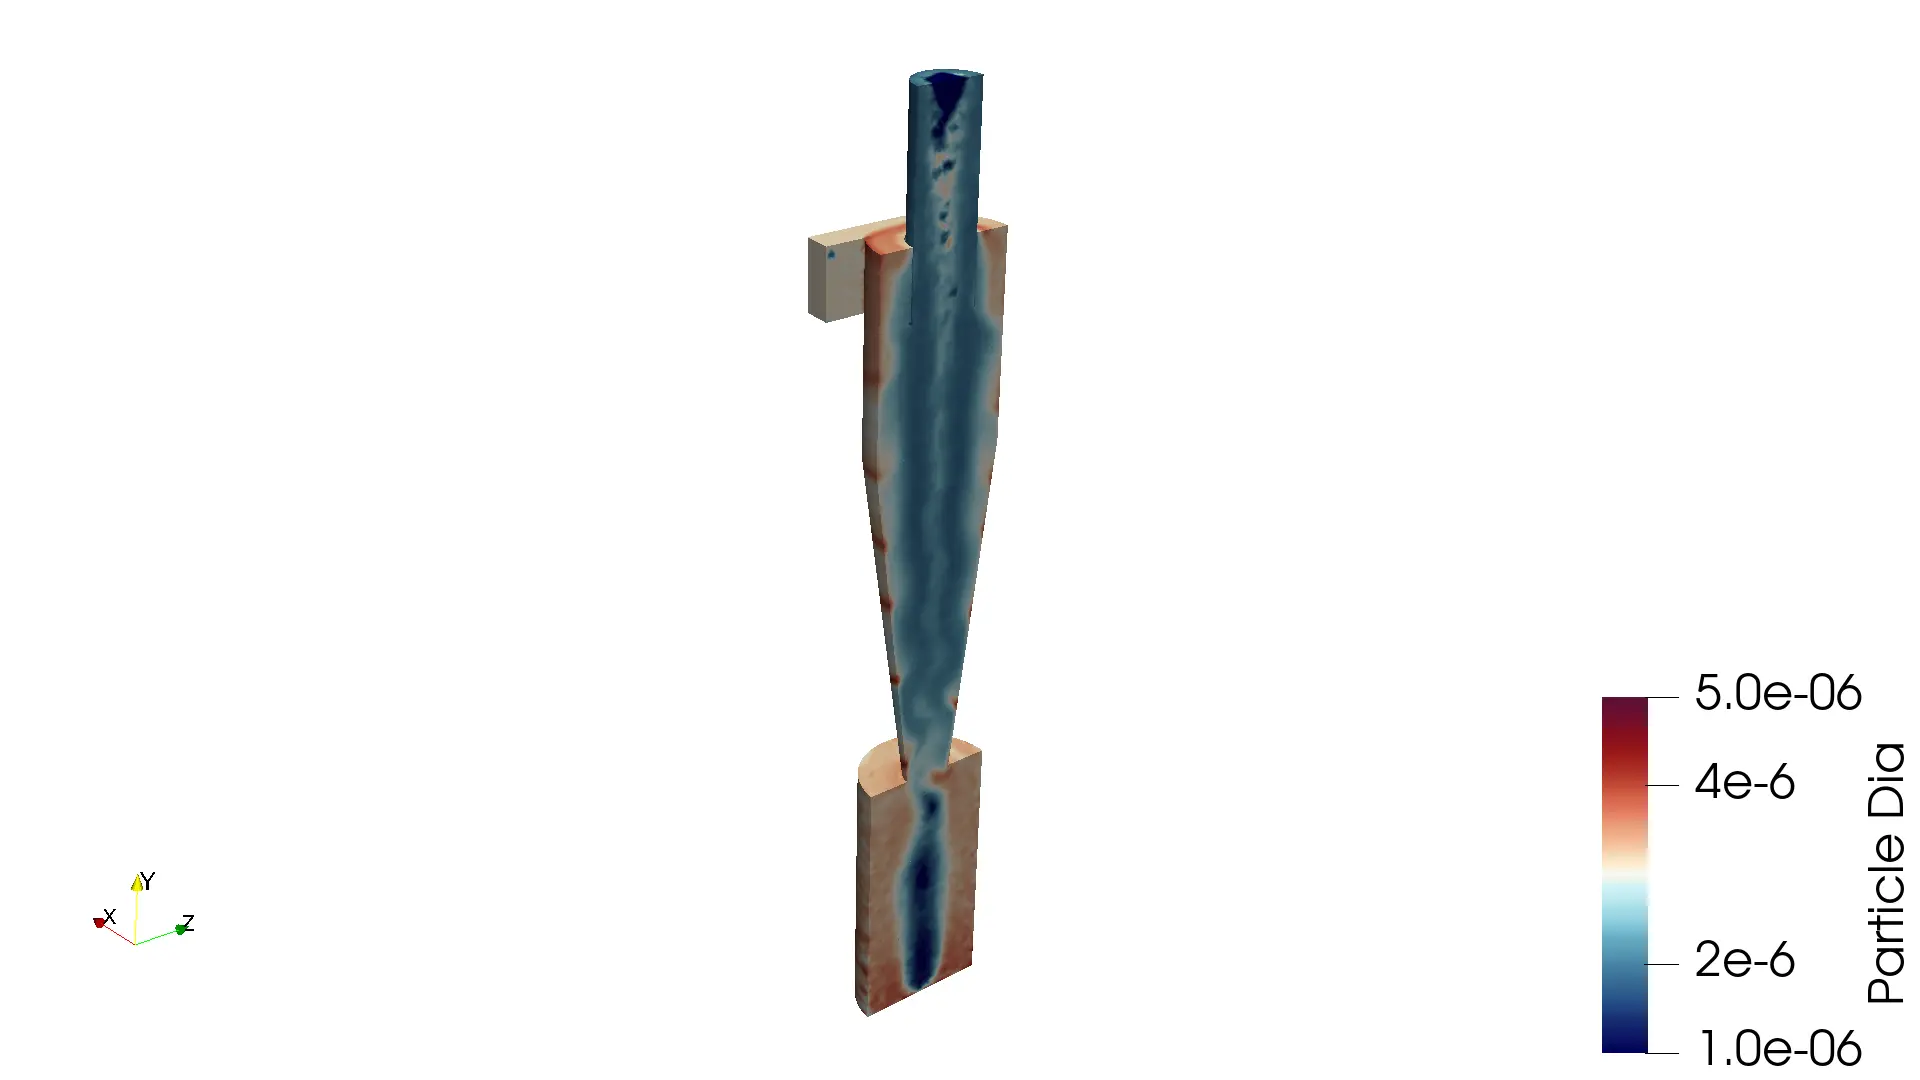
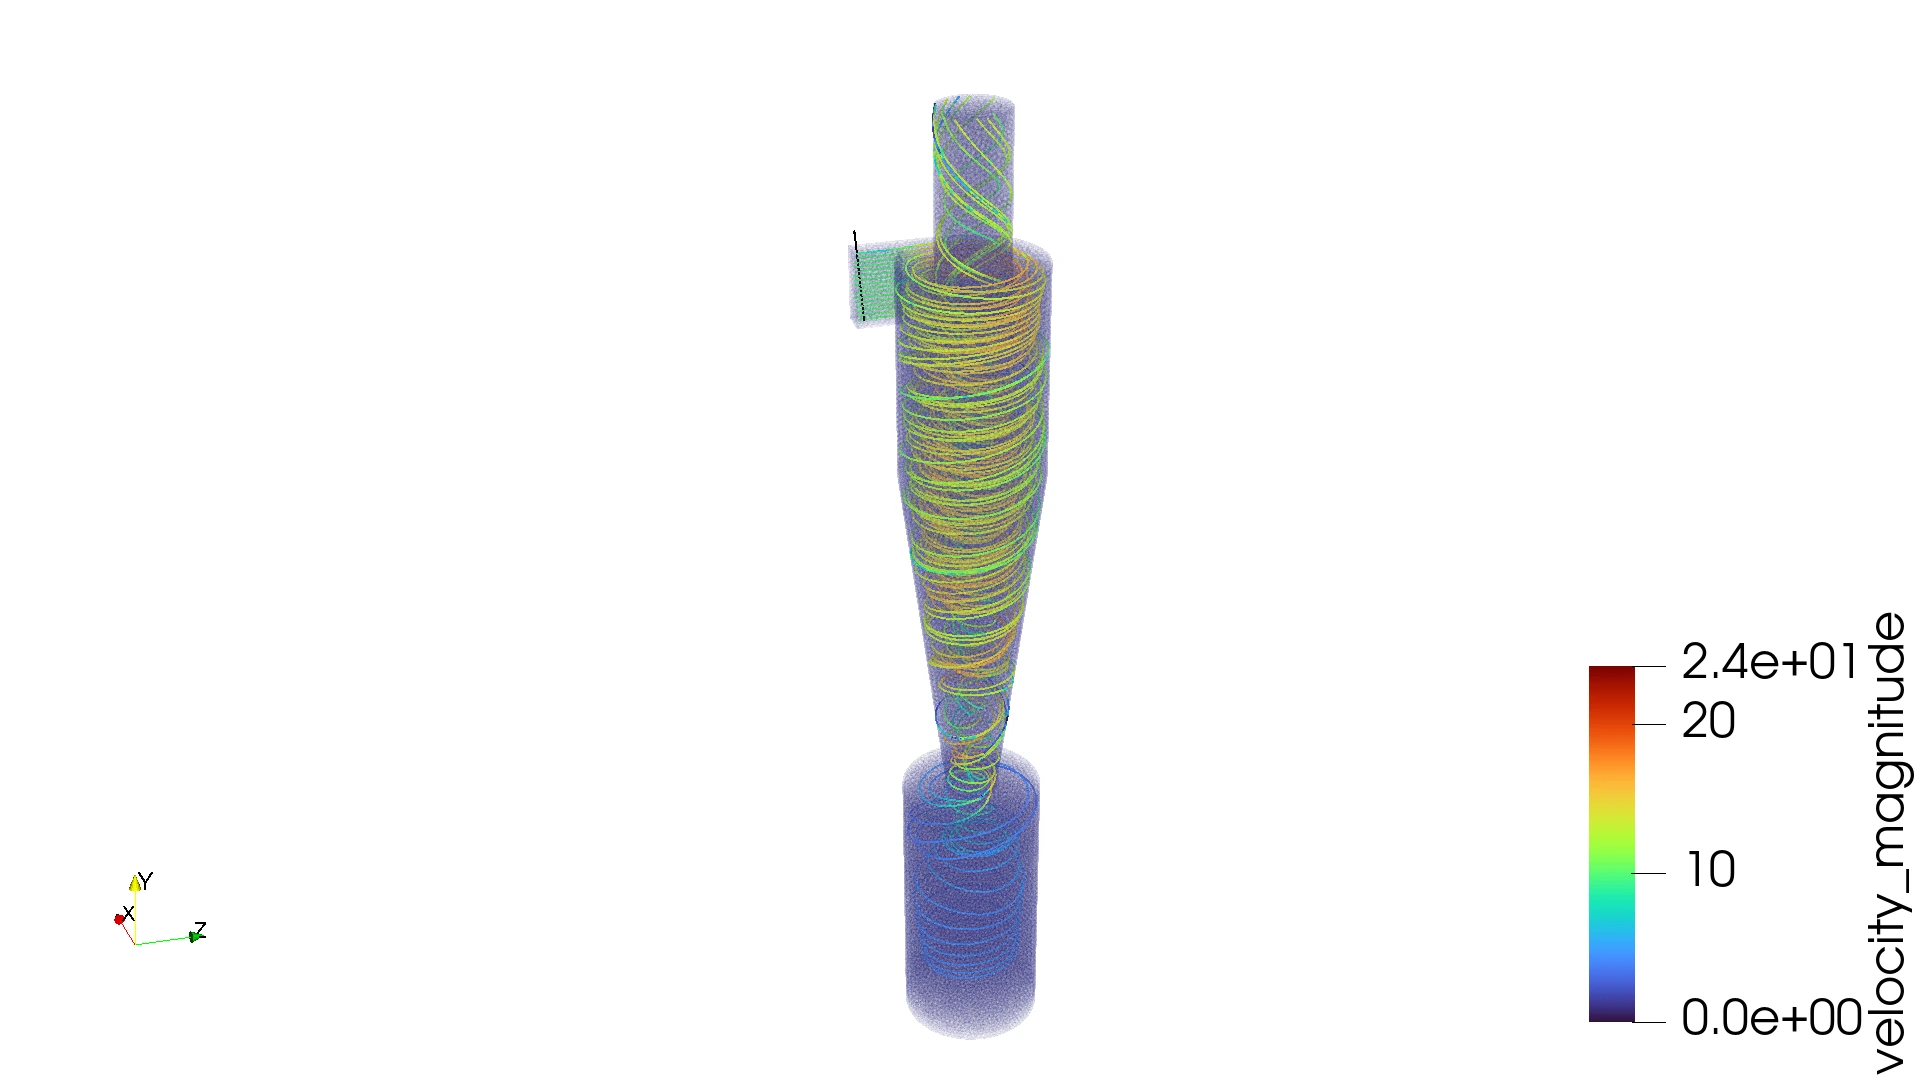
To provide a deeper look into the internal physics of the cyclone, the following contours illustrate the velocity streamlines and the spatial distribution of particles. The streamlines highlight the high-velocity outer vortex and the low-pressure central core.
Further consideration
Euler Number
Determines the geometric pressure-loss coefficient.
- Eu: Euler Number (-)
- ΔP: Static Pressure Drop (Pa)
- ρ: Gas Density (kg/m³)
- vin: Inlet Velocity (m/s)
Operational Power
Calculates system fan power requirements.
- Pfan: Absorbed Fan Power (W)
- Q: Volumetric Flow Rate (m³/s)
- ΔP: Pressure Drop (Pa)
- η: Fan Efficiency (0.6 – 0.8)