External Aerodynamics Validation Portfolio: Airfoils & 3D Wings
Comprehensive Assessment of Subsonic and Transonic Flow Fields
To demonstrate the fidelity of our Computational Fluid Dynamics (CFD) workflows, this portfolio presents a rigorous validation study of external aerodynamic flows. High-fidelity numerical simulations were conducted across both 2D airfoils and complex 3D wing geometries, spanning compressible subsonic and shock-inducing transonic regimes. By benchmarking our computational results directly against established experimental wind tunnel data, we showcase the predictive accuracy required to optimize lift, minimize drag, and manage wave phenomena in critical engineering applications.
Understanding the Aerodynamic Flow Regimes
Subsonic Flow (M < 0.8): The flow speed everywhere in the domain remains strictly below the speed of sound. Air behaves as a continuous medium, pressure changes propagate upstream smoothly, and compressibility effects are relatively minor at lower Mach ranges; however, they cannot be omitted from the simulation due to their cumulative impact on predictive accuracy as the velocity increases.
Transonic Flow (0.8 < M < 1.2): A highly complex regime where subsonic and supersonic flows coexist simultaneously. While the freestream velocity is subsonic (e.g., M = 0.75), local acceleration over the curved upper surface of the airfoil breaches the speed of sound (M > 1.0). This supersonic pocket is almost always terminated by a sharp normal shock wave, which induces an aggressive pressure rise, rapid wave drag penalties, and potential boundary layer separation.
Supersonic Flow (1.2 < M < 5.0): The flow velocity across the entire field safely exceeds the speed of sound. Pressure disturbances can no longer travel upstream, resulting in the formation of permanent, inclined oblique shocks or bow shocks at the leading edge, fundamentally shifting how lift and drag forces are generated.
Benchmarking Predictive Accuracy for NACA 64A010 Transonic Validation
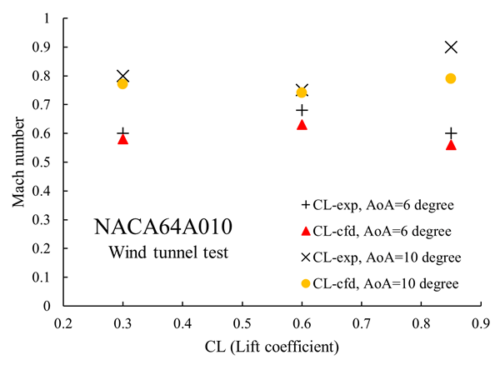
This validation study evaluates the aerodynamic performance of the symmetrical NACA 64A010 airfoil profile, utilizing high-fidelity Computational Fluid Dynamics (CFD). The primary objective was to verify the predictive accuracy of our numerical framework against the definitive experimental wind tunnel dataset published in the NACA Research Memorandum RM A9E31 by Albert D.
Simulations were conducted across a sweeping high-subsonic to transonic envelope, matching the exact test conditions of Mach numbers ranging from M = 0.3 to M = 0.85 at Reynolds numbers spanning 1e6 to 2e6. The primary focus was validating the non-linear behavior of the section lift coefficient (C_l) and section drag coefficient (C_d) under compressible flow states.
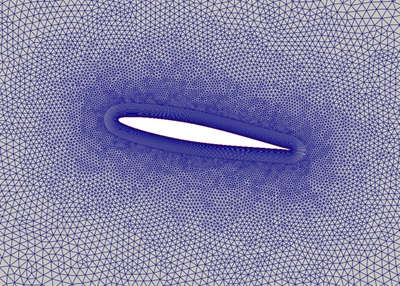
Due to the inherently unstable, time-dependent nature of transonic shock wave movements and shock-induced boundary layer separation, a steady-state formulation proved physically inadequate; a high-fidelity transient (time-dependent) solver was therefore mandated to capture the fluctuating flow fields accurately. This transient setup was paired with the k-omega SST turbulence model and a highly resolved Boundary Layer (BL) mesh, which is a strict necessity in external aerodynamics to capture the severe velocity gradients governing skin friction drag and to prevent the artificial smoothing of shock-wave/boundary-layer interactions. Although computational resource limitations over the large domain resulted in a slightly elevated near-wall grid spacing of y+ approx 5, the model’s robust automatic wall functions successfully compensated, capturing the exact non-linear lift divergence and shock physics to achieve an impressive 10% predictive accuracy relative to the experimental test results.
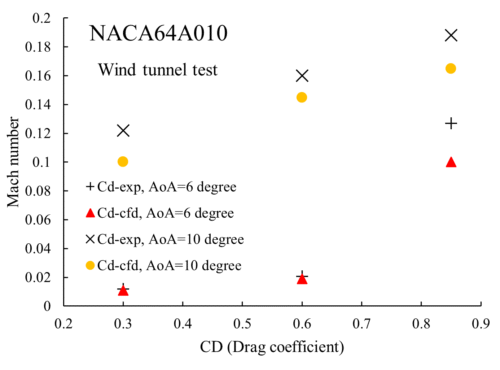
The CFD results show high fidelity across the subsonic and transonic regimes (M=0.3 to 0.85), with Cl and Cd trends closely matching experimental benchmarks. The model accurately captures the drag divergence at higher Mach numbers, effectively resolving the shock wave formation and associated pressure gradients.
Transient CFD visualization of transonic buffet over a NACA 64A010 airfoil (M=0.85, α=6 degree), demonstrating shock-induced boundary layer separation. Change of vorticity and temperature by time.
Streamline Visualization of Von Kármán Vortex Generation
3D Transonic Wing CFD: Streamline and Tip Vortex Circulation Analysis at M=0.85
Considerations for transonic flows
Prandtl-Glauert Compressibility Correction
At low speeds, air behaves as if it’s incompressible — its density stays roughly constant. But as an aircraft approaches transonic speeds (Mach 0.3+), air starts to compress significantly, which increases the lift and pressure forces beyond what incompressible theory predicts. You need a correction for pressure and lift coefficients.
Prandtl-Glauert Compressibility Corrections:
Sutherland’s Law (Viscosity Temperature Dependence)
In your transonic cases, the temperature changes significantly near the shock waves. Showing Sutherland’s Law proves you are accounting for how air viscosity changes with temperature—a hallmark of high-end aerospace CFD. S represents the Sutherland constant
Sutherland’s Law (Dynamic Viscosity):